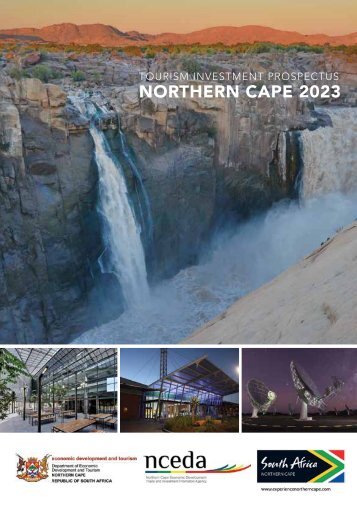
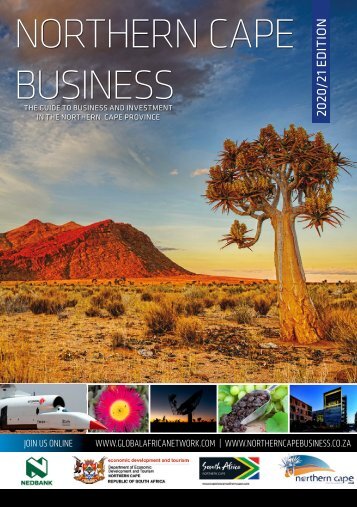
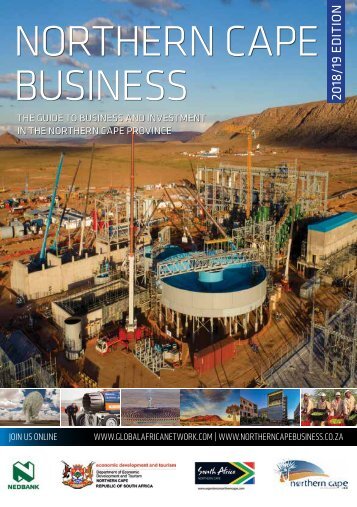
Since its launch in 2009, Northern Cape Business has established itself as the premier business and investment guide to the Northern Cape Province. The 2019/20 edition is officially supported and used by the Northern Cape Department of Economic Development and Tourism.
Northern Cape Business is unique as a business and investment guide that focuses exclusively on the province. In addition to comprehensive overviews of sectors of the economy, this publication has a particular focus on specific, packaged investment opportunities.
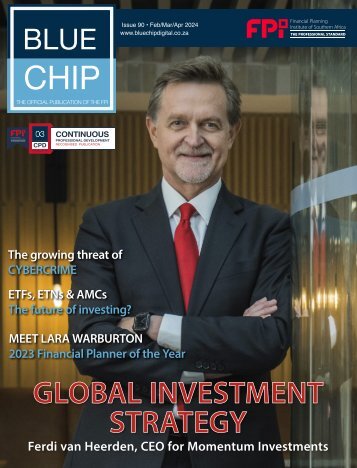
The massive potential represented by the Square Kilometre Array radio telescope project and the rapid progress being made by Sol Plaatje University are also highlighted in this edition.
All FDI into NorthernCape, South Africa Data for companies from source countries investing in NorthernCape in activities between January 2011 and March 2016 Project Date Investing NO Company Mar-15 Enel Green 1 Power Jan-15 ACWA Power 2 International 3 Jan-15 Engie (GDF SUEZ) (Gaz de France Parent Company Source Country Source City Capital Investment Sub-Sector Enel Italy Rome 2557.833087 Solar electric power ACWA Saudi Arabia Riyadh 14060.46589 Solar electric Power power International Engie (GDF France Paris 2557.833087 Solar electric SUEZ) (Gaz power de France Industry Activity Electricity Electricity Electricity Jan-15 Sonnedix Solar Sonnedix Netherlands Amsterdam 2568.378436 Solar electric Electricity 4 Solar power Nov-14 Sesa Sterlite Vendanta UK London 7381.744593 Copper, Electricity 5 Resources lead,nickel,zinc Nov-13 Sunpower Total France Paris 2343.410982 Solar electric Electricity 6 power Oct-13 Mainstream Mainstream Ireland Dublin 2568.378436 Wind electric Electricity 7 Renewable Renewable power Power Power Oct-13 Mainstream 8 Renewable Power Oct-13 Mainstream 9 Renewable Power Mainstream Renewable Power Mainstream Renewable Power Ireland Dublin 2568.378436 Wind electric power Ireland Dublin 2568.378436 Wind electric power Electricity Electricity Sep-13 Acciona Acciona Spain Alcobendas 2441.834243 Solar electric Electricity 10 power Sep-13 ACWA Power ACWA Saudi Arabia Riyadh 6151.453828 Solar electric Electricity 11 International Power power International May-13 Scatec Solar Scatec AS Norway Oslo 2348.449316 Solar electric Electricity 12 power Feb-13 Globeleq Globeleq South East UK London 2568.378436 Solar electric Electricity 13 Generation Generation power Nov-14 Mainstream 17 Mainstream Jan-12 Powerway Ireland Powerway Dublin China 2568.378436 Foshan 0.23434109 Solar electric Steel products Electricity Manufacturin 14 Renewable Renewable Renewable Renewable Energy 8 power g Power Power Energy Nov-12 Mainstream Mainstream Ireland Dublin 82.01938437 Solar electric Electricity 15 18 Jan-12 Powerway Powerway China Foshan 0.23434109 Other Manufacturin Renewable Renewable power Renewable Renewable Energy 8 fabricated g Power Power Energy metal pro Jan-12 Powerway Powerway China Foshan 0.234341098 Other Education & 16 Renewable 19 Renewable Jan-12 Powerway Powerway China Foshan 0.23434109 fabricated Coating, Training heat Manufacturin Energy Energy Renewable Renewable Energy 8 metal prds treating ,etc g Jan-12 Powerway Powerway Energy China Foshan 0.234341098 Steel products Manufacturing 17 Renewable Renewable Energy No Energy Projec Investing Parent Company Source Source City Capital Sub-Sector Industry Jan-12 Powerway Powerway t Date Company China Foshan Country 0.234341098 Investment Other Manufacturing Activity 18 Renewable Renewable fabricated Energy 20 Energy Dec-11 Abengoa Abengoa Spain Seville 2283.65400 metal pro Solar electric Electricity 2 power Jan-12 Powerway Powerway China Foshan 0.234341098 Coating, heat Manufacturing 19 Renewable Renewable treating ,etc 21 Dec-11 Abengoa Abengoa Spain Seville 2283.65400 Solar electric Electricity Energy Energy 2 power Dec-11 Abengoa Abengoa Spain Seville 2283.654002 Solar electric Electricity 20 22 Dec-11 Anglo American Anglo American UK London 11717.0549 power Iron ore mining Extraction Dec-11 Abengoa Abengoa Spain Seville 2283.654002 1 Solar electric Electricity 21 power Dec-11 Anglo American 23 Anglo Dec-11 Scatec Solar UK Scatec AS London Norway 11717.05491 Oslo 3091.31059 Iron ore Solar Extraction electric Electricity 22 American 7 mining power Dec-11 Scatec Solar Scatec AS Norway Oslo 3091.310597 Solar electric Electricity 23 24 Dec-11 Solar Reserve Solar Reserve United Santa 2568.37843 power Solar electric Electricity States Monica 6 power Dec-11 Solar Reserve Solar United States Santa Monica 2568.378436 Solar electric Electricity 24 Reserve power 25 Jul-11 David Brown Clyde Blowers UK East 58.5852745 General Maintenance Jul-11 David Brown Clyde UK East Kilbridge 58.58527455 General Maintenance 25 Group Kilbridge 5 purpose & Service Group Blowers purpose machinery & Service machinery May-11 Diana Group 26 Diana May- Group Diana France Group Diana Not Group specified France 326.905832 Not 326.905832 Paints, Paints, Manufacturing 26 Manufacturin (Groupe Diana) (Groupe 11 (Groupe Diana) (Groupe Diana) specified coatings& coatings& g Diana) adhesive adhesive May-11 Diana Group Diana Group France Not specified 326.905832 Paints, Manufacturing 26 (Groupe Diana) 27 (Groupe Feb-11 Jupiter Mines Jupiter Mines Australia Perth 2343.41098 coatings& Nonmetallic Extraction Diana) 2 adhesive mineral mining Feb-11 Jupiter Mines Jupiter Australia Perth 2343.410982 Nonmetallic Extraction 27 Mines mineral mining Source: Investment South Africa (ISA) the dti